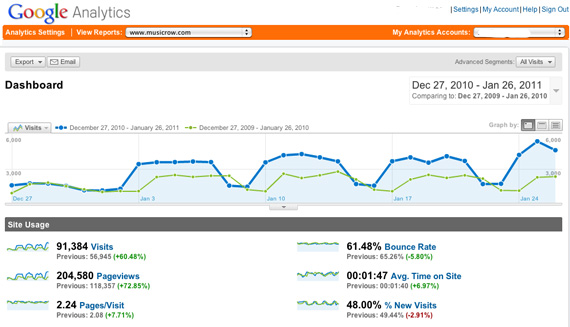
MusicRow’s digital content distribution engine [web site] has been enjoying a steady surge in traffic thanks to our dedicated readers. The above graph, compiled by Google analytics, compares www.musicrow.com traffic from Dec. 27, 2010 to Jan 26, 2011 with that of the same period one year ago.
As the report shows, all key indicators are growing rapidly. Visits are up over 60% and Pageviews have increased almost 73% for the period.
The graph’s blue line (current period) and green lines intersect during the holiday period (Dec. 27-Jan. 2) when the industry is enjoying holiday season vacations. After the holiday, the current (blue) traffic dominates the graph. The 204,580 pageviews shown over the 31 day period averages about 7,000 per day.
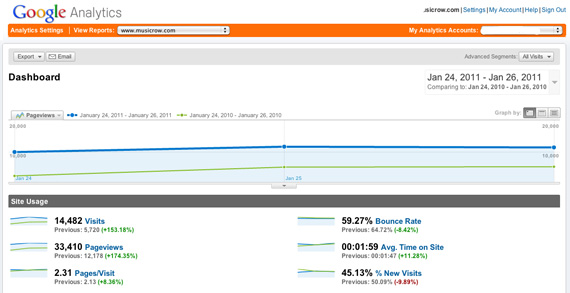
Recently, the readership has been accelerating even faster. The lower graph shows pageviews for Jan. 24, 25 and 26. All three days passed the 10,000 per day mark escalating all comparisions.

Category: Featured
About the Author
David M. Ross has been covering Nashville's music industry for over 25 years. dross@musicrow.comView Author Profile


